Anupam Prabhugouda Patil
AI engineer & quantitative finance researcher. I build agent systems that run research autonomously — and test whether popular quant ideas survive honest out-of-sample evaluation, publishing the code either way.
Automation engineering @ GRD Trucking · MS Finance, UC Riverside · 3 working papers · open to forward-deployed / AI engineer & quantitative research roles — global
Working Papers
My research agenda is the honest out-of-sample evaluation of quantitative finance claims: the field produces models faster than it validates them, and the backtest-overfitting literature shows why most published edges are artifacts. I build the evaluation machinery — walk-forward protocols, forecast-comparison tests, tail-risk backtests — and apply it to claims that matter. Every number below reproduces from public data with one command; automated tests re-verify the papers’ results on every commit.
How Many Retail Trading Strategies Survive Honest Evaluation?
A systematic survey: eight classic strategy families, full parameter grids, judged by the backtest-overfitting toolkit
Built a research engine that tests classic retail strategy families — momentum, mean-reversion, trend, turn-of-month, volatility-managed and more — across their entire parameter grids, then judges every one through a pre-registered evaluation gate: Deflated Sharpe Ratio, Probability of Backtest Overfitting, minimum backtest length, and a held-out 70/30 out-of-sample split, net of costs. Hypotheses are frozen in a public registry before running; a scheduled agent re-validates them weekly on newly accrued data and flags any unregistered addition as a mining violation.
Do Hidden Markov Regimes Add Out-of-Sample Value?
Separating fat tails from hidden states in volatility forecasting, density calibration, and tail risk
Implemented Gaussian and Student-t hidden Markov models from scratch (Baum–Welch, Viterbi, online filtering) — the mathematics Renaissance Technologies was founded on — and fielded them against GARCH-Normal/t, EWMA, and simpler baselines across three scoring dimensions: variance point forecasts (QLIKE, Diebold–Mariano, Hansen–Lunde–Nason model confidence sets), predictive densities (log score, Berkowitz), and tail risk (VaR at 1/2.5/5% with Kupiec & Christoffersen backtests; expected-shortfall calibration), plus crisis-window analysis and a state-count sweep.

Do Machine-Learning Filters on Directional-Change Events Survive Out-of-Sample?
A cautionary study across equities and commodities
Reproduced a published event-based trading strategy and subjected it to the discipline of the backtest-overfitting literature: expanding-window walk-forward evaluation, realistic transaction costs, and stationary block-bootstrap significance tests. The naive trade-every-event rule is strongly loss-making after costs; an ML filter rescues it but never generates statistically significant excess returns over buy-and-hold.

Method as identity: reproducibility as a first-class result
Every estimator in both papers is implemented from first principles and validated on synthetic data with known properties (known hidden paths, known GARCH dynamics, known quantile coverage) before touching markets. Every number regenerates from public data with one command, and a continuous-integration test suite re-verifies the papers’ anchor results on every commit — the green badges above are live. Results that cannot be re-derived are claims, not findings.
The Governed Desk — Leo’s Trading Firm
Forty-five agents collect, forecast, trade on paper, and — the part that matters — argue with themselves on a fixed schedule. Every number passes a deflation gate before it may be published; a daily council interviews every lab; a resolver closes an issue only when a machine test proves it; and a shared brain of paid-for mechanisms is read by every agent before it acts. The product so far is honest: zero strategies have cleared the gate — and the machinery that keeps producing that answer is the portfolio.
One entry per session at executable prices, scored at settle (|close−K|, never a mid). Registered expecting to lose against the desk’s own measurement — confirming it forward is the result.
Cross-lab canon of paid-for mechanisms (“a guard that checks the clock has not checked the data”). A lesson bought once is never bought twice; a wiring check fails if any agent stops reading it.
Display-matches-source, no weekend check dates, refusals state reasons, empty books must exist. Several were proven by deliberately breaking them first — a test that cannot fail teaches nothing.
Explore the Hidden States
This is my model running on 27 years of S&P 500 data — a 3-state Gaussian HMM, fitted by Baum–Welch, with each week coloured by its decoded hidden state. Hover to inspect; the lower band is the smoothed probability of the turbulent state. The model was never told what volatility is — it discovered these regimes, and the leverage effect (calm markets drift up, turbulent markets crash down), from raw returns alone.
Interactive chart: vanilla JS, no libraries. Data exported directly from the paper’s fitted model.
The Honest Evaluation Game
Think you can beat the market? Prove it — then let my research judge you. You’ll trade a hidden 18-month slice of real S&P 500 history. The tape plays in real time; toggle between LONG and FLAT whenever you like (2 bps cost per switch). When it ends, I run the same statistics on you that my papers run on trading strategies: Sharpe ratio, excess return over buy-and-hold, and a block-bootstrap significance test. Then I reveal when you were trading — and what my model’s hidden states knew about it.
Keyboard: L long · F flat. Real weekly S&P 500 closes; window drawn at random from 1999–2026.
Live Demos
Real-time data apps you can open right now — no login, no API key, running entirely in the browser on live public feeds.
Crypto Self-Learning Forecaster ↗
A 15-minute price forecast that makes a point prediction every minute, scores itself against a random-walk baseline 15 minutes later, and adapts by gradient descent. Features include live order-flow and book imbalance. Honest by design — it tends to learn there is no edge, and shows you the scoreboard proving it.
Insider Radar ↗
A live feed of corporate insider open-market purchases — the rare event of an executive spending their own cash on their own stock — with detection of buy clusters (≥2 insiders, same stock, 14 days), the variant of the signal with the strongest academic support. Sales are deliberately ignored as noise.
Live Events Tracker ↗
A world map of live earthquakes, the ISS, and aircraft — plus a self-learning seismic module that fits the Gutenberg–Richter b-value (~1.0) live and rate-forecasts against a naive baseline. The instructive contrast: self-learning genuinely beats the baseline here (stationary seismic rates), where it can't for crypto prices.
An AI-Engineered Research Desk That Runs Itself
The research above isn’t run by hand. I build and operate a fleet of LLM-agent and scheduled-automation systems that collect data, take registered paper trades, mark books against live option chains, score their own forecasts, and audit their own inputs — every day, unattended. This is the engineering I want to do professionally: agents deployed against a real, messy domain, with verification designed in.
Deterministic guardrails for LLM agents → the lab
The rule underneath everything on this page: the model proposes, and something else decides whether the proposal executes. I pulled that discipline out of my production system into four small, independently tested primitives — a finite-state guard, an idempotent executor, a default-deny policy gate, and a hash-chained event log that survives a crash by replay. Each ships with tests proving exactly one guarantee: an undeclared transition cannot fire, a retried action runs its side effect exactly once, anything not allow-listed is blocked, and a tampered log entry breaks the chain. The demo routes a toy broker-email triage through all four, kills the process mid-run, and rebuilds the final state from the log alone.
A pre-registered paper-trading arena
Twelve frozen mechanical rules take paper trades daily on a 120-ticker universe. Every rule is written into a public registry with its thesis before it runs; the full blotter, open book and per-rule record are committed to the repo on every run. A weekly sentinel agent diffs the code against the registry and flags unregistered strategies as mining violations.
The forward record, drawn from the committed blotter
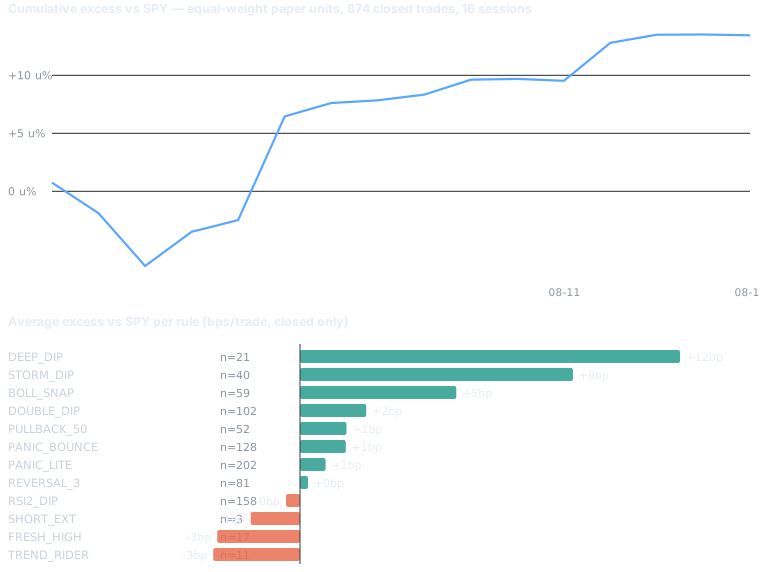
Regenerated from reports/arena_trades.csv — equal-weight paper units, not capital returns. Honest caveats apply and are in the paper: few independent entry days, a survivorship-tilted universe, and a mean-reversion family the 15-year backtest already convicted. The forward record decides; this is it accruing in public.
Self-scoring forecast ledgers
Every research agent must file probabilistic forecasts, which are scored later with Brier decomposition (calibration vs resolution) — agents are graded on calibration, not on being right. The crypto forecaster and seismic module below are public examples: each keeps a scoreboard against a naive baseline and shows it, including when the honest answer is “no edge.”
Case study: one wrong price → read it
My own book recorded QBTS at a price it hadn’t traded at for weeks — every one of ~50 automated checks was green. The write-up covers the diagnosis (a stale feed fossilizing into a permanent record), the correction that violated my own audit rule, and the structural fixes, each proven by breaking it first. The most FDE-shaped thing I’ve written.
Input-integrity tooling
Validated analysis on unvalidated inputs is still wrong — so the desk grew its own guards: recorded entry prices are checked against the tape, every published figure carries a provenance stamp naming its inputs, options marks carry a quality flag (stale source, wide book) and untrusted marks are shown struck through rather than silently believed.
Unattended data collectors
Scheduled agents (launchd + GitHub Actions) run an SEC EDGAR Form 4 collector, a Coinbase order-flow recorder, an after-close intraday day-type recorder, and options-chain snapshots — growing datasets that make previously unanswerable questions testable. The insider feed and its Pages viewer deploy automatically on every collection.
The Question I Want to Pursue in a PhD
Experience
Automation Engineer / Analyst — GRD Trucking
- Designing and building the company’s dispatch and billing automation: document ingestion, order entry, rating and invoicing pipelines replacing manual spreadsheet workflows.
- LLM-assisted document processing for the messy reality of freight paperwork — rate confirmations, PODs, invoices — with human-review checkpoints where accuracy is contractual.
- Forward-deployed in practice: requirements come from dispatchers mid-shift, and the software has to survive contact with real operations the same week.
Financial Analyst — Friendly Franchisees LLC
- Led monthly FP&A reporting across 60 operating units — revenue trends, cost structure, operating-margin performance.
- Prepared monthly and quarterly reporting packages: variance analysis, KPI dashboards, executive summaries for senior leadership.
- Developed forecasting and budgeting models incorporating operational metrics, improving planning accuracy.
- Supported lender reporting, covenant-compliance monitoring, and DSCR analysis for refinancing and acquisition transactions.
- Contributed to a 12% EBITDA improvement through cost tracking, labor-efficiency analysis, and benchmarking.
Real Estate Analyst Intern — Silverstar Real Estate
- Built DCF and scenario models for acquisitions across a $30M+ portfolio.
- Sensitivity and downside-risk analysis under changing market conditions.
Portfolio Manager — Hylander Student Investment Fund
- Co-managed the fund to a 16.8% FY return; directly managed a $28.5K industrial-sector allocation.
- Pitched Howmet Aerospace (HWM): +33%, the fund’s best performer.
Chief Financial Officer — International Collegiate Business Strategy Competition
Led financial strategy; placed 1st in the presentation category.
Projects & Code
Everything public, at github.com/jarvisss007.
regime-monte-carlo
From-scratch HMMs (Gaussian & Student-t), GARCH benchmarks, regime-switching Monte Carlo, full tail-risk evaluation toolkit. 20 CI-verified tests. Home of working paper #2.
dc-ml-trading
Directional-change event engine, walk-forward ML backtester, block-bootstrap inference. Home of working paper #1. MIT licensed, citable (CITATION.cff).
StockTrak post-mortem
Doubled a $1M simulated portfolio in 8 weeks (+109%) — then wrote the CAPM/Carhart regression showing it was beta 7.5, not alpha. Honest evaluation is the brand.
Option-analysis
Options analytics pipeline: chain data, Black-Scholes Greeks, ML classification, backtests (2024).
Stock-analysis
Early equity-trading experiments: features, ML, PPO reinforcement learning (2024).
backtest-overfitting
Tools for detecting when a backtest is fooling you: Deflated Sharpe Ratio, Probability of Backtest Overfitting (CSCV), minimum backtest length. The honest-evaluation thesis as a reusable library.
strategy-lab
The systematic survey engine: 8 strategy families judged by the deflation+PBO gate, a frozen pre-registration registry, and a 12-rule paper-trading arena whose forward book commits daily. Home of working paper #3.
crypto-microstructure
Live Coinbase order-flow dashboard, self-learning 15-min forecaster, and an honest backtest harness (IC, permutation test, cost-aware). Live ↗
live-events-tracker
No-key world map of earthquakes, the ISS, and flights with a self-learning seismic module (Gutenberg–Richter b-value, rate forecasting). Live ↗
insider-radar
SEC EDGAR Form 4 collector + live feed of insider open-market purchases with buy-cluster detection. Live ↗
this site
Vanilla HTML/CSS/JS, no frameworks; the regime explorer renders my paper’s fitted model.
Publications
How Many Retail Trading Strategies Survive Honest Evaluation? A Systematic Survey
8 strategy families × full parameter grids; Deflated Sharpe, PBO/CSCV, OOS holdout, pre-registered hypotheses, live forward test.
Do Hidden Markov Regimes Add Out-of-Sample Value? Separating Fat Tails from Hidden States
7 models × 3 assets × 3 scoring rules; Kupiec/Christoffersen/Berkowitz backtests, model confidence sets, crisis windows.
Do Machine-Learning Filters on Directional-Change Events Survive Out-of-Sample? A Cautionary Study
Walk-forward, transaction costs, stationary block-bootstrap inference; a reproducible null.
A New Computerized Method of Detecting Leukemia
Classification of leukemia types from microscopic blood-cell images.
An Automated Detection of Leukemia
Early-stage disease detection via image analysis of blood samples.
Education
Master’s in Finance — University of California, Riverside
Financial econometrics, quantitative finance, options & futures, fixed-income securities, portfolio theory, risk management.
B.E., Biomedical Engineering — B.M.S. College of Engineering
Applied mathematics, programming, signal processing; Operations Research elective (93/100) sparked the turn toward quantitative methods.